Improving the On-Campus Retail Experience: A UX Research Case Study
Generative & Evaluative UXR • Consumer Behavior • Interview & Survey Design • Quantitative Analysis
Overview
The District Market (DM) at the University of Washington (UW) serves as a primary on-campus grocery store for students, offering essential items like produce, pre-made meals, and household supplies. Since opening in 2012, it has become a key resource for students, offering convenience and accessibility. However, with the changing needs and expectations of the student population, it is crucial to understand how well the DM aligns with their shopping behaviors and preferences. This research aims to explore the current on-campus shopping experience, identify areas of improvement, and propose design recommendations that can enhance operational efficiency and increase user retention among the student population.
Project Scope
Research Categories: Generative, Evaluative
Duration: 11 weeks
Tools & Platforms: FigJam (Affinity diagramming, thematic analysis), Google Forms (survey design & deployment), Microsoft SharePoint and Google Docs (transcript coding), Excel (Pivot Tables, VLOOKUP)
Research Deliverables:
Field observation protocol & behavior mapping
Thematic codebook & interview insights report
Quantified survey insights with pivot table analysis
Design implications aligned to business KPIs
Research Objectives
To identify and address friction points in the student shopping experience at District Market (DM), a university-operated on-campus grocery store located at the University of Washington. The focus was to uncover how students make purchasing decisions in real-world conditions—and how those behaviors, needs, and motivations could inform design opportunities that improve operational efficiency, satisfaction, and accessibility.
Problem Statement
How might we improve the shopping experience at the District Market (DM) for University of Washington students?
To address the ‘How Might We’, I conducted a three-stage research approach to inform actionable design recommendations.
Field Study: Identify key pain points like low basket usage, reliance on phones, and avoidance of crowded sections.
Interviews: Understand the ‘why’ behind shopper motivations, challenges with budgeting, and the impact of store layout on purchasing decisions.
Surveys: Validate findings by quantifying preferences around budgeting tools, store navigation, and product availability.

Key Insights
1
Low Basket Usage
Field Observation Findings
To reduce the influence of external factors on the shopping behavior of participants, data is collected with the intention of maintaining a low profile. By recording observations on the iOS Notes app on a mobile phone, the notetaking method allows the observer to take usable notes while not staying out of the participants’ way. Each participant was identified in field notes with numbers in the chronological order that they were spotted in the session. In addition, timestamps were included in a three to five minute interval to provide context of the duration of behaviors and traffic patterns of the environment. Specifically, the observer collected data on participants’ browsing behavior and focus by section, technology used, and what possessions they had or have acquired during the shopping experience. Furthermore, field notes indicated if the participant was seen more than once throughout the session.
Several patterns were identified from field observations of students shopper at the District Market:
Data collected across the three field sessions revealed correlation between the usage of the DM basket and time spent in different areas of the DM. Observations indicated that more than half of the shoppers do not use baskets, especially if they do not pass by the basket section near the front door upon entering. In addition, those who carry baskets tend to spend more time in various sections of the DM, as they tend to be seen more than once by the observer throughout the session. This observation includes repeated visits to certain sections and a more prolonged browsing time before putting an item into the basket. Shoppers who carried baskets lingered longer in different areas, such as the dairy section, compared to those without baskets. Those without baskets, tend to spend less time on decision making, even when they purchase multiple items.
Data collected from the three field sessions suggest media consumption plays a role in an individual's shopping experiences. Shoppers who used their phones while browsing, whether through messaging, looking up information, or consulting shopping lists spent longer periods at sections. Additionally, some shoppers move to a different section or focus on specific products after receiving messages or calls, indicating that media consumption may have directly influenced their decision-making. Whether or not these media serve as an aid in purchasing decision-making or a distraction is unclear from the field observations.
Throughout the field sessions, data collected suggests that shoppers often avoid engaging with certain product sections of the DM if they see long wait times, crowded spaces, or hard-to-view displays. For example, multiple shoppers in the freezer section only paused briefly due to the fogged-up glass doors, while picking up items to examine at other sections. Only a few shoppers opened the freezer door to browse in detail, indicating that the difficult visibility impacted shoppers’ interest in products. Additionally, long lines such as the deli / pre-made meal bar section seemed to impact some shoppers to leave the area temporarily or skip the section, suggesting that perceived inconvenience in accessing items may result in shoppers looking for alternative products.
1
“Limited budgeting tools lead to extra effort in managing spending”
In the field study, many shoppers were observed to be comparing items near the fridge section before heading to the checkout line. A few were seen hesitating before placing items back on shelves from their baskets, suggesting a concern over budget. In the interviews, participants confirmed that due to limited meal plan funds and the lack of existing tools to track spending, they put extra effort into budgeting. P03 mentioned calculating a daily budget with their phone calculator, and P02 mentioned balancing spendings in their head.

Areas of focus that guided data collection during field observation.

Work back schedule outlined for Stage 1.
2
Media Consumption While Shopping
2
“Interior layout of the DM contributes to a low-effort, quick visit that shoppers prefer”
From the field study, many shoppers entering the DM without baskets often head directly to a specific section, spending minimal time browsing. Similarly, all participants emphasized that they value efficiency when making DM trips in the interview. For example, P02 stated a preference for “low effort and high efficiency” trips, and P03 mentioned skipping the basket to minimize time when purchasing a few items. However, participants also noted that some aspects of the DM layout, such as awkward placement of baskets and cramped freezer area, impacted the ease of navigation.
3
“Inconsistent product availability is a source of frustration for shoppers”
As observed in the field study, a few shoppers walked away from the soup and hot food bars after quick glances, suggesting possible dissatisfaction with the available food options. In interviews, participants reported the frequent unavailability of preferred items and the inconsistent food menu, especially for dietary-specific products. P03 shared that as a pescatarian, they often see sudden changes to the hot bar menu and have to make another visit on a different day and hope for specific food items. P02 shared that they had to make a visit to off-campus locations after spending a while searching for an ingredient they couldn’t find.
Interview Findings
The interview questions were designed to address the study’s high-level questions related to shoppers’ behaviors and experiences at the DM. The interviews began with open-ended questions about the participants’ experiences living on campus, their use of the meal plan funds, and transitioned to asking them to talk about their most recent visit to the DM. These general questions allowed the interviewers to understand participants’ habits and interests that could provide a starting point for more specific questions. In addition, the questions acted as a warm up for participants before elaborating on their experiences for the rest of the interview. As the session progressed, I focused on areas such as their decision-making process, convenience, and basket usage in order to understand their perspectives and uncover new or existing insights through follow-up questions. Interviews were concluded by asking participants to reflect on their overall experience in a larger context such as comparing the DM to other grocery stores. This comprehensive approach allowed an additional set of rich data that may potentially reveal factors influencing participants’ shopping decisions.
The findings are prioritized in order based on their feasibility, potential impact on user satisfaction, and profitability for the District Market:
Work back schedule outlined for Stage 2.

Survey Findings
3
Navigation, Traffic, and Layout
1 Lower dining plan levels correlate with greater interest in using digital tools for planning purchases
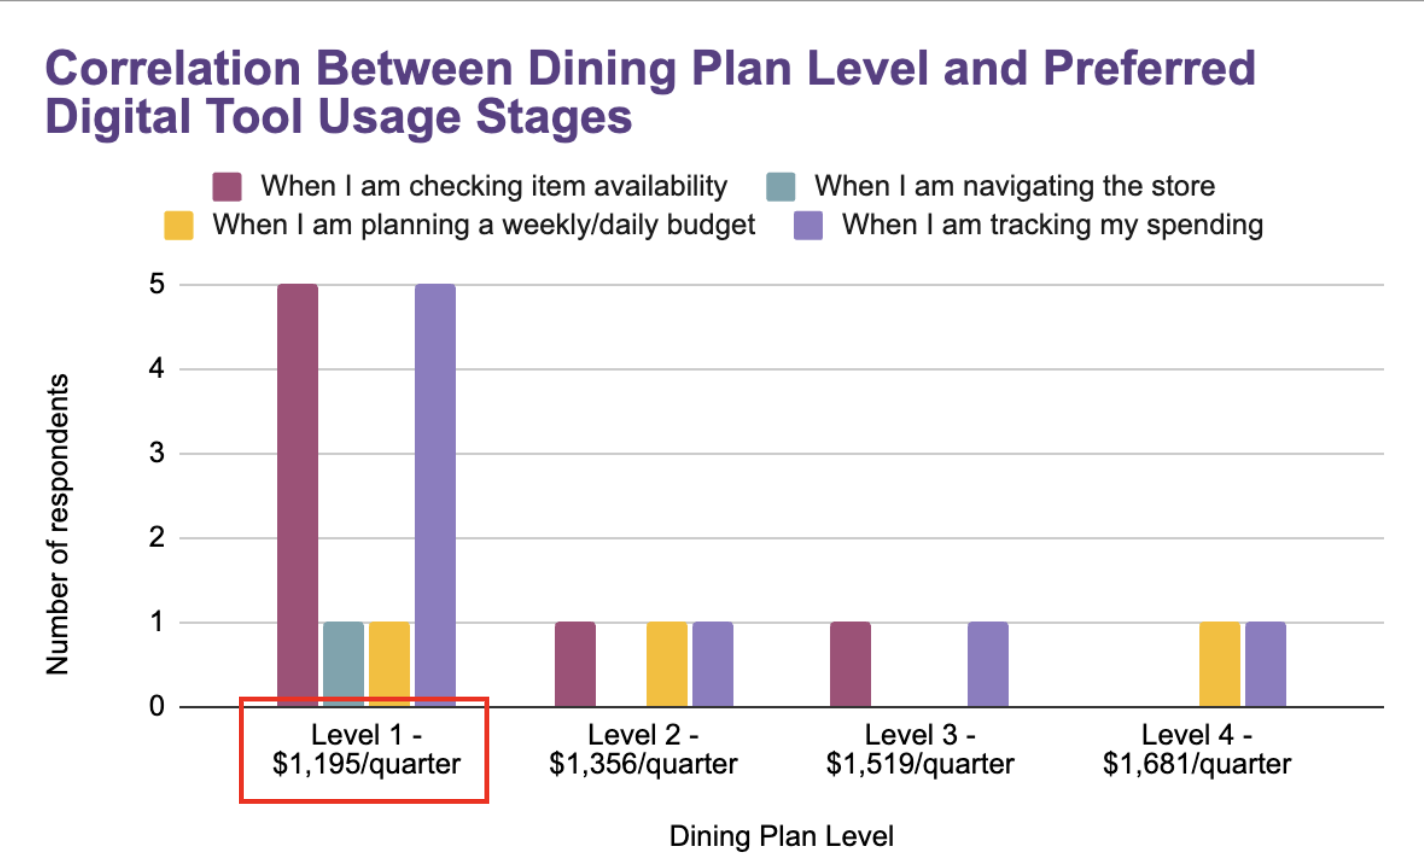
Compared to higher-level dining plan holders, student on a Level 1 dining plan were more likely to plan ahead and self-report stress related to financial constraints.
This aligns with earlier findings from interviews, where participants described relying on mental math or phone calculators to track meal plan spending. Survey data adds behavioral segmentation to these anecdotes, indicating a correlation between financial constraints and the desire for digital support tools.

>Design Implications
A budgeting dashboard or weekly spending report embedded in existing apps like MyUW
Real-time item availability checks to reduce uncertainty before and during visits
Notifications for overspending or low remaining balance thresholds
2 Frustration surrounding unpredictable hot bar menu correlates with dissatisfaction of limited dietary options

The hot bar menu emerged as a consistent pain point, with only one respondent indicating full satisfaction on a 7-point scale. Even among those “somewhat satisfied,” complaints around limited dietary options and inconsistent availability were common. The overlap in frustrations across satisfaction tiers suggests that minor adjustments (e.g., improved communication or alternative options) could shift users from neutral to positive experiences.
This aligns with earlier interview findings (e.g., P03's pescatarian restrictions) and field observations of shoppers walking away from the hot bar without making a selection. Survey findings reinforced that this friction impacts a broad range of shoppers, not just those with specific dietary needs.

>Design Implications
Provide physical/digital real-time updates on the hot bar menu, which could be an addition to the DubGrub, an UW ordering app
Clearer on-site labeling for dietary information
AI inventory tracking tool to to ensure alternative options are stocked
Operational strategies to improve consistency or communicate unavailability transparently
3 Online browsing is ranked highly by shoppers who simply leave when products are unavailable

Survey results revealed a strong link between shoppers who leave without purchasing due to unavailable products and those who prioritize online browsing in their ideal experience. Respondents in this group ranked features like inventory lookup and planning tools as top improvements, suggesting that real-time access to stock information could reduce visit abandonment.
By contrast, the pivot table shows those who reported waiting for restocking or seeking substitutes placed lower value on online browsing features, indicating distinct behavioral profiles. This supports a differentiated approach to digital support, recognizing that those who value efficiency are more likely to abandon visits and require stronger pre-visit planning tools.


Those who leave when products are unavailable may be due to their concerns about efficiency, as quickly finding what they’d like to purchase is a top priority
>Design Implications
Develop an organized online browsing platform for those who like to plan
Reduce perceived “wasted visits” by offering product availability notifications
Focus on marketing and profitability opportunities through introducing “Related items” or “Suggested substitutes” to guide shoppers to alternatives
Research Impact
User Impact
Research clarified key usability issues in the current on-campus retail experience, including poor in-store wayfinding, low visibility of store-provided resources (e.g., baskets), and lack of mobile integration during the shopping journey. Semi-structured interviews identified user needs around budget tracking, efficiency, and planning—needs not currently supported by the physical or digital experience. Insights led to design recommendations targeting specific pain points such as improved product organization, clearer signage, and mobile-first planning tools to reduce shopper uncertainty and cognitive load.
Strategic Impact
Findings redefined user segmentation from a generalized “student shopper” to distinct behavioral profiles (e.g., time-constrained faculty, budget-conscious students). This enabled more targeted design strategies. Survey analysis and behavioral clustering identified correlations between dining plan usage, mobile phone reliance, and in-store navigation patterns. These insights informed a service blueprint for hybrid retail journeys, with opportunities to prototype cross-channel features (e.g., mobile pick lists, contextual prompts based on past purchase behavior).
Business and Organizational Impact
The study surfaced experience-level barriers contributing to low average basket size and inconsistent traffic across store zones. By identifying friction points and prioritizing interventions with high potential ROI (e.g., improved shelf categorization, signage aligned to purchase intent), the research supports goals such as increased purchase conversion, stronger meal plan value perception, and greater use of auxiliary services (e.g., promotions or loyalty offerings). These insights are directly applicable to institutional retail operations and scalable to partner organizations exploring service modernization.

Future Work and Research Extensions
Expand and Validate Behavioral Segmentation
To generalize findings beyond the initial participant sample, a scaled quantitative survey should target a broader demographic (including graduate students, staff, and commuters). This would allow for more granular comparisons of shopper motivations, constraints, and decision-making strategies across dining plan levels and academic roles. Longitudinal research, including repeat surveys and interviews across different quarters, could also identify how student priorities shift over time (e.g., budgeting concerns at quarter end vs. start).
Focus on Hot Bar Experience Gaps
While initial data suggested dissatisfaction with the hot bar, a targeted observational study of this specific zone could isolate designable service touchpoints—such as signage clarity, queue management, or product visibility. Follow-up interviews with users who frequently avoid or abandon this section would uncover root causes of frustration and clarify dietary inclusion needs. This would inform potential menu updates or digital feature prototypes (e.g., real-time menu previews with dietary filters).
Prototype and Evaluate Digital Planning Tools
Given the strong demand for digital support—especially among budget-conscious shoppers—future work should explore technical feasibility and user desirability of features such as real-time item availability trackin, budgeting calculators and alerts, and online browsing with personalized recommendations.
Partnering with internal stakeholders (e.g., UW IT, Housing & Food Services) to scope integration with existing platforms like MyUW or DubGrub could increase feasibility and adoption efforts. Early-stage user testing could validate minimum viable features and assess the ROI of digital augmentation for physical retail.
Investigate High-Impact Environmental Adjustments
Survey responses showed that increasing basket station visibility was the most commonly requested physical improvement. This suggests an opportunity to study spatial friction in more depth. Targeted observations at entry points, basket areas, and checkout lines—collected at different times of day—could inform low-cost interventions with measurable impact on shopper behavior (e.g., signage placement, layout revisions).
Compare Preferences for Physical vs. Digital Shopping Aids
Future surveys and A/B testing scenarios could compare user preferences and efficacy between in-store signage improvements and digital planning tools. This would inform cross-channel strategy and determine which types of users are more responsive to which modality—valuable for building an inclusive omnichannel experience.
Methodologies
Desk Research: Understanding the purpose and context of the District Market (DM) within the University of Washington’s Housing, Food, and Services (HFS) system. This helped contextualize the research findings within the broader institutional goals and student needs.
Site Visit: Prior to conducting field observations, a site visit was conducted to familiarize the researcher with the DM layout, operations, and current conditions. This initial walk-through provided a general sense of the physical environment and allowed for early identification of potential research focal points.
Observational Study: A "deep hanging out" methodology, where the researcher spent time in the DM to observe students’ shopping behaviors. This approach allows for initial contextual inquiry, holistic understanding of the environment, and student interactions with the space.
Three 30-minute structured observation sessions were conducted, focused on understanding how students navigated the space, interacted with the products, and their use of technology during the shopping process.
Affinity Diagramming: After each observation, the raw notes were proofread and transferred from the iOS Notes app to a Google Document for organizational purposes. The observations were then categorized and analyzed using an affinity diagramming technique in FigJam.

Stage 2: Qualitative User Interviews
Drilling into user intent and validating observed behaviors

Screener Survey: A screener survey was designed with inclusion and exclusion criteria to identify eligible participants who were regular shoppers at the DM and could provide meaningful insights based on their shopping experiences.
Semi-Structured Interviews: Building on the field observations, semi-structured interviews were conducted to gain a deeper understanding of students’ motivations, shopping behaviors, and pain points. This method was chosen for its flexibility, allowing me to probe specific issues while leaving room for participants to provide unique perspectives.
Interviews were conducted with regular DM shoppers, aiming to explore their decision-making processes, budget constraints, product availability concerns, and layout preferences. The interviews were audio-recorded with consent, transcribed, and analyzed using thematic coding techniques in Google Docs and FigJam.
Coding Interview Transcripts: Interviews were recorded using the iOS Voice Memo app and transcribed in Microsoft Word. Transcriptions were then uploaded to Google Docs for coding.
Qualitative analysis: A codebook was created and refined over multiple iterations with the interview data.

Codebook Iterations on Google Sheets
Thematic analysis: The data was then analyzed through thematic analysis on FigJam to identify recurring patterns and insights.

User Surveys: The user survey was created in the last stage to quantify insights from stage 1 & 2.The survey aimed to identify key pain points, validate user preferences, and prioritize improvements based on the broader user base, helping inform targeted design recommendations for the UW District Market.
Survey Tool: Administered via Google Forms, chosen for its accessibility, ease of use, and compatibility with both mobile and desktop devices.
Data Segmentation: Responses were segmented based on frequency of visits, dining plan usage, and other demographics to identify patterns.
Statistical Analysis: Responses on a Likert scale were analyzed to quantify budgeting habits, pain points, and preferences. This helped assess the level of satisfaction or frustration with different aspects of the shopping experience, including budgeting, product availability, and the desire for digital tools. Trends and correlations were identified from multiple-choice questions, revealing factors influencing shopping decisions, frustrations, and the effectiveness of potential design improvements.

Data Visualization with Excel:
To facilitate clear interpretation of the survey data, Excel was used to create visualizations such as bar charts and pivot tables. These visual tools highlighted key correlations between survey responses, which informed design opportunities based on user feedback.
Stage 1: Field Study
Gaining context and high-level insights of design space
Stage 3: Survey Research
Quantifying Insights for Design Recommendations
Reflections & Learnings
Using complementary methods across sequential stages of research contributed to a holistic understanding of target users. Contextual inquiry through field observation helped map the physical and behavioral landscape of the store environment. Semi-structured interviews then surfaced users’ motivations and constraints behind those behaviors. Finally, surveys quantified patterns at scale, allowing me to validate and prioritize insights.
The research approach evolved as new findings emerged. Patterns from earlier stages directly informed the next—interviews were scoped around observed friction points, and survey questions were derived from recurring themes in interview data. This iterative framework allowed me to refine problem spaces, progressively narrowing in on actionable design opportunities rather than assuming static research questions.
The flexibility and value in semi-structured interviews for problem discovery. While I started with a set of guiding questions, many of the most impactful insights came from follow-up questions and moments where I let participants steer the conversation. This flexibility was especially useful in unpacking behaviors surfaced during the field study—like media consumption, basket avoidance, or in-store navigation patterns—that required deeper qualitative context.
Digging into survey data, especially through Excel’s pivot tables and filters, felt like a creative puzzle—testing hypotheses, slicing data by user segments, and uncovering hidden relationships between budgeting behavior and shopping patterns. It reminded me that user research isn’t just about gathering data; it’s about discovering the story within it.
This case study sharpened my understanding of retail user behavior—balancing constraints like budgeting, spatial layout, and product discovery. It also explored opportunities for digital augmentation within physical spaces.